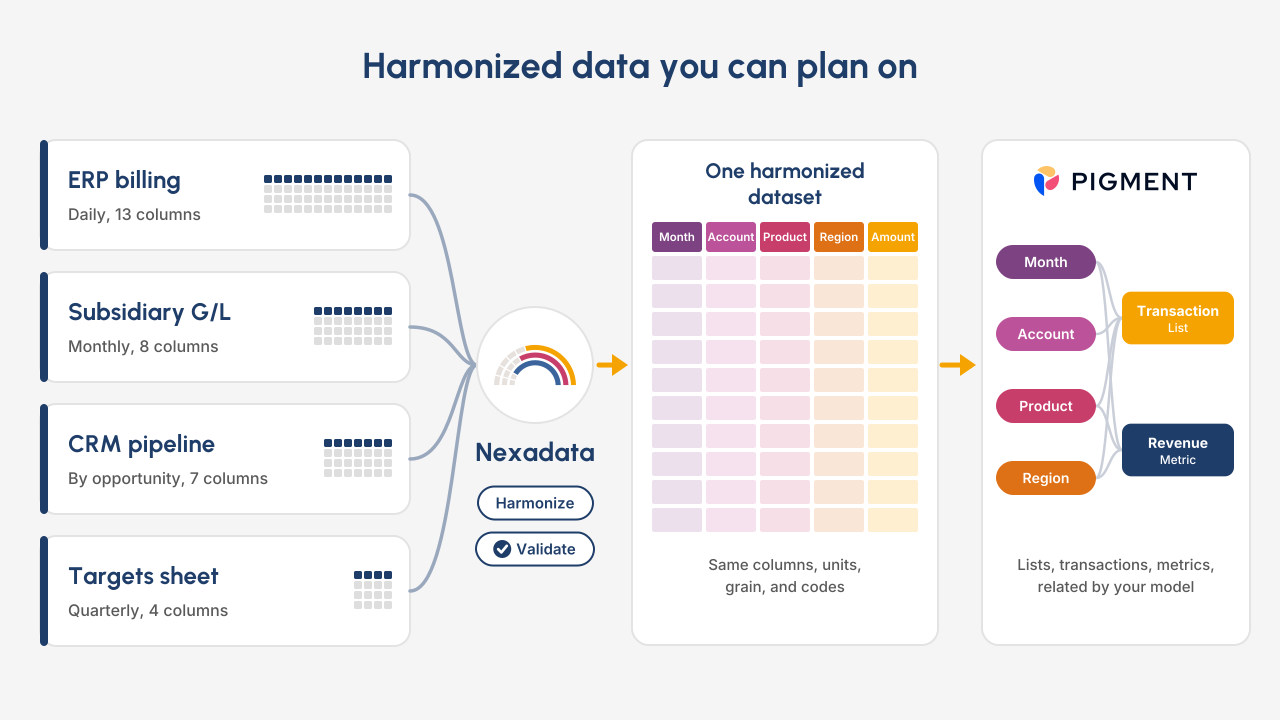
Harmonization is one of those words that gets used a lot and explained very little. Ask ten people what it means and you’ll get ten answers, most of them some version of “cleaning up the data.” So instead of a definition, here’s a picture we built with the Pigment team in mind, and a walk through what each part of it is doing.
Every source arrives in its own shape
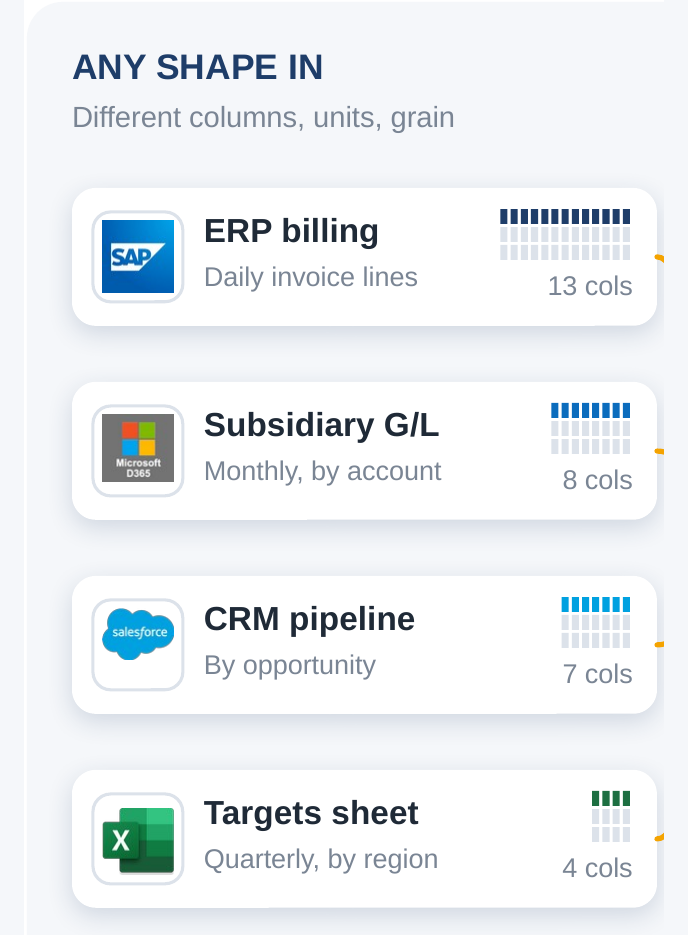
Start on the left. Four sources feed one plan, and each one was built for its own job.
- ERP billing from SAP comes in as daily invoice lines, 13 columns wide.
- A subsidiary G/L in Microsoft Dynamics is monthly, by account, 8 columns. Think of the company acquired a couple of years ago that still runs its own books.
- The CRM pipeline in Salesforce is by opportunity, 7 columns.
- The targets sheet is a spreadsheet someone in FP&A owns. Quarterly, by region, 4 columns.
The column counts are the obvious difference. The more interesting ones are underneath. The units differ. The dates differ. The grain differs, so one row means an invoice in one source, a monthly account balance in another, and a deal in a third. The codes differ too: the same product carries one ID in SAP and another in the CRM.
None of that’s a flaw in any of those systems. Billing should be daily. A sales team should think in opportunities. Every finance team I know has some version of this picture, and the work is getting all of it to speak the same language before it reaches the plan.
One shape, cycle after cycle
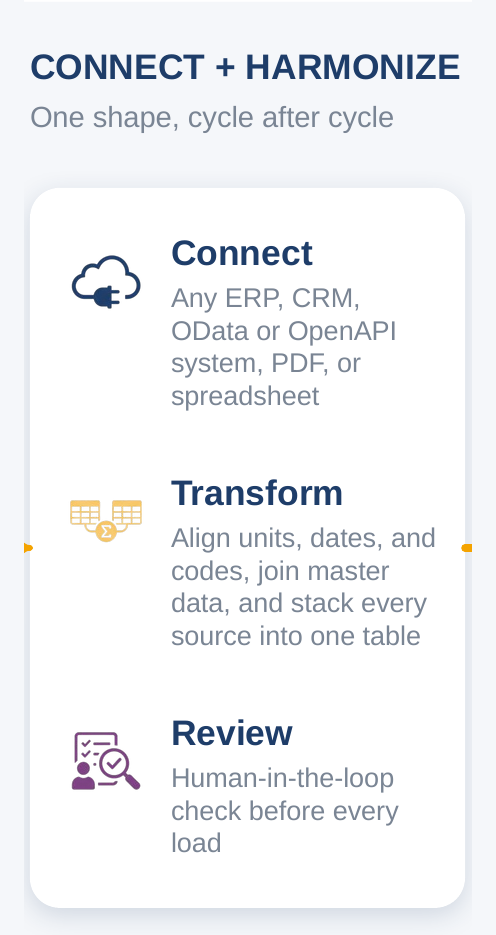
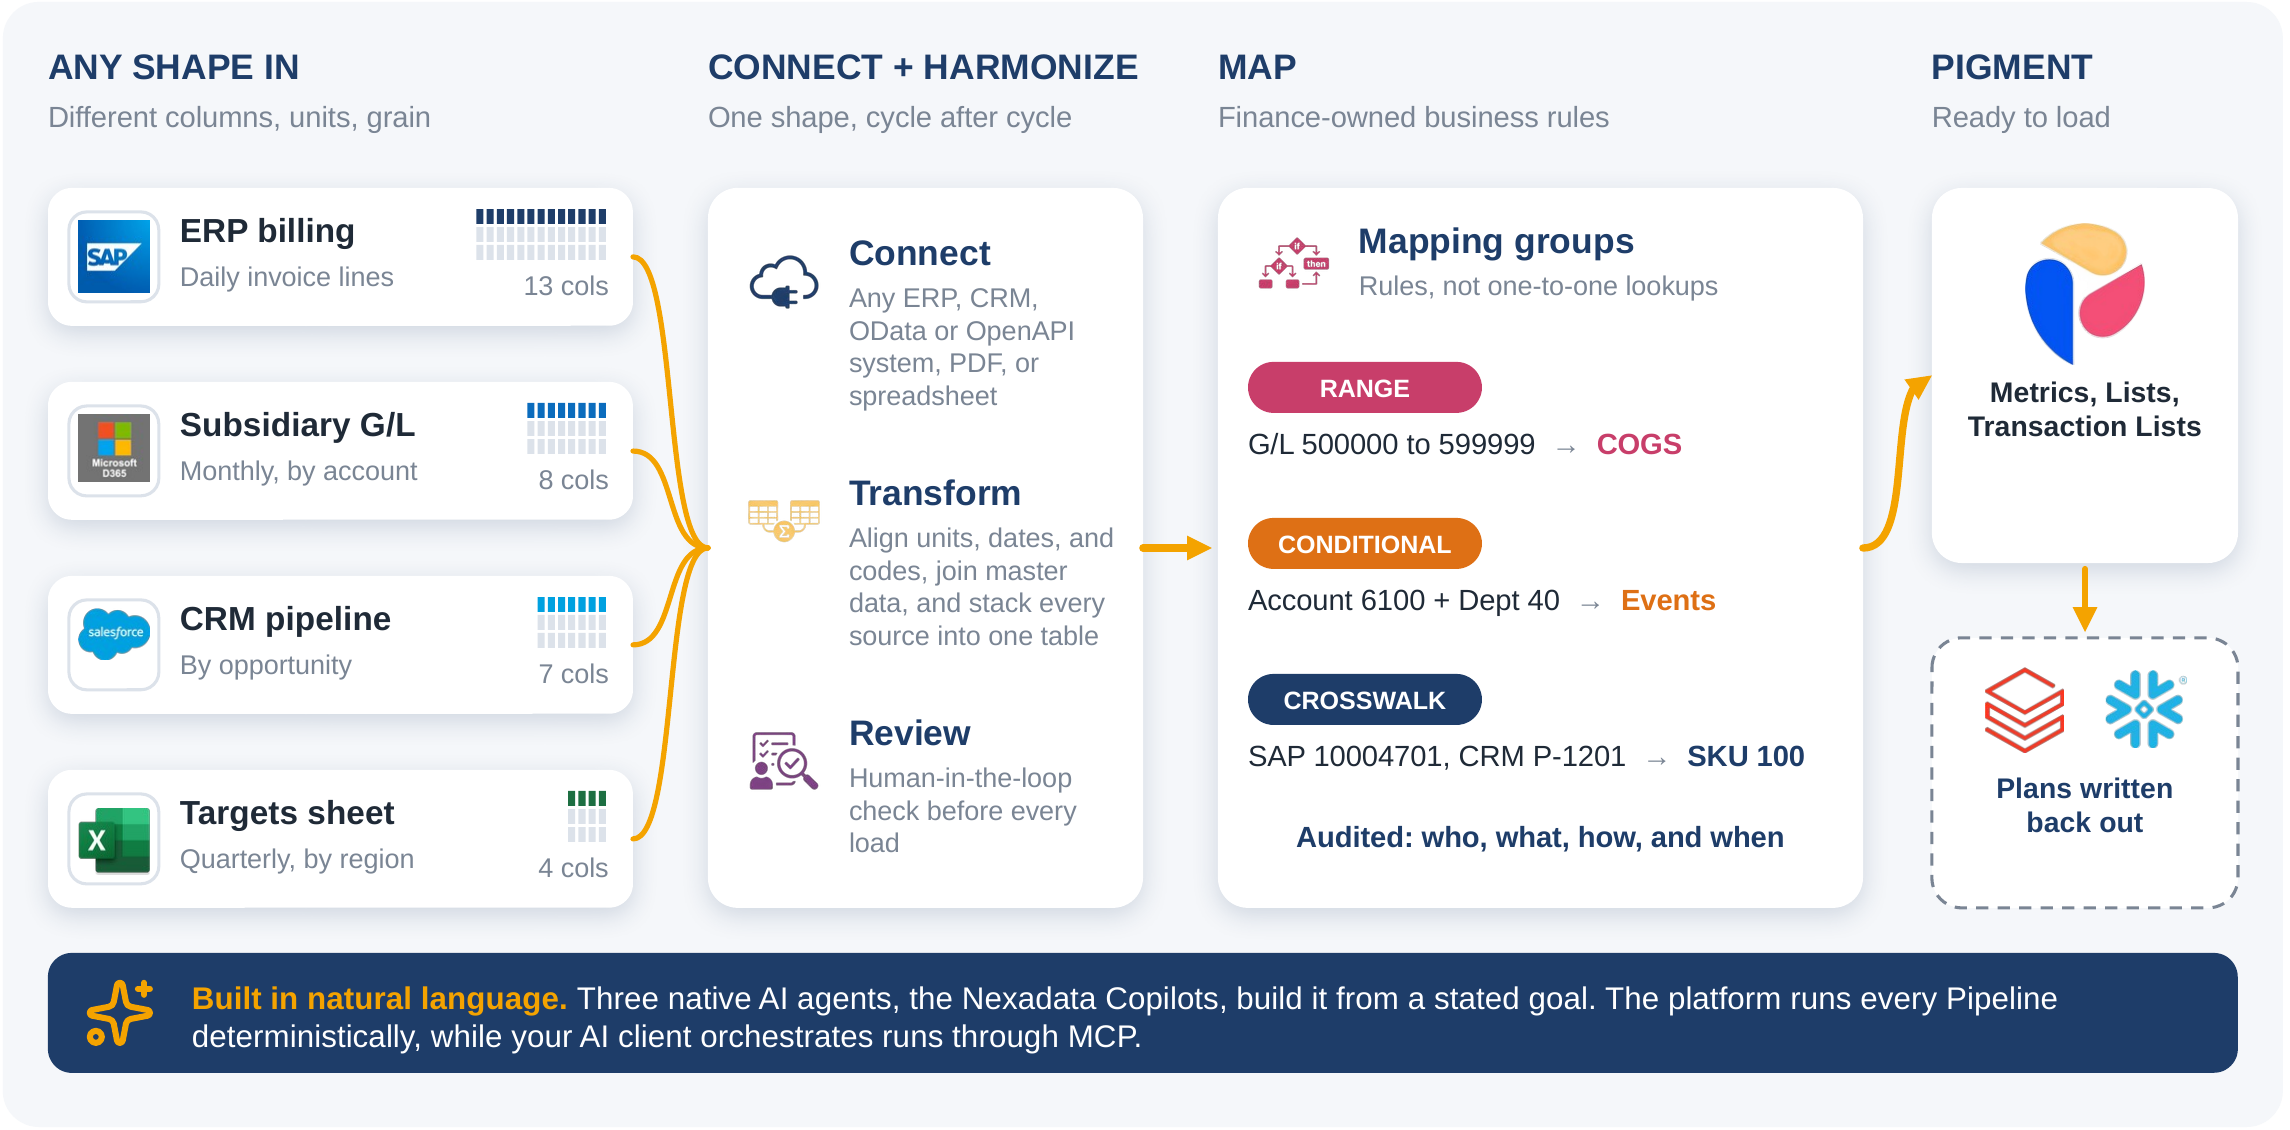
The middle column is where the shapes come together.
Connector Copilot makes the connection, whether the source is an ERP, a CRM, any OData or OpenAPI system, a PDF, or a spreadsheet. Transform Copilot does the reshaping: it aligns units, dates, and codes, joins in master data, rolls the daily lines up where they need to be, and stacks every source into one table.
None of that starts with code. It starts with a request, something like this:
“Combine SAP billing with our subsidiary G/L, summarize by month, product, and region, and map accounts to our P&L.”
Transform Copilot takes the first half of that sentence. The second half, mapping accounts to the P&L, is where the business rules come in, and you’ll see excerpts of those below.
If I had to pick one phrase on the diagram, it’s “cycle after cycle.” Getting four sources into one shape once is a project. Doing it every close without rebuilding it is the real job. That’s also why there’s a Review step, so a person can validate the result before anything loads.
Rules finance owns
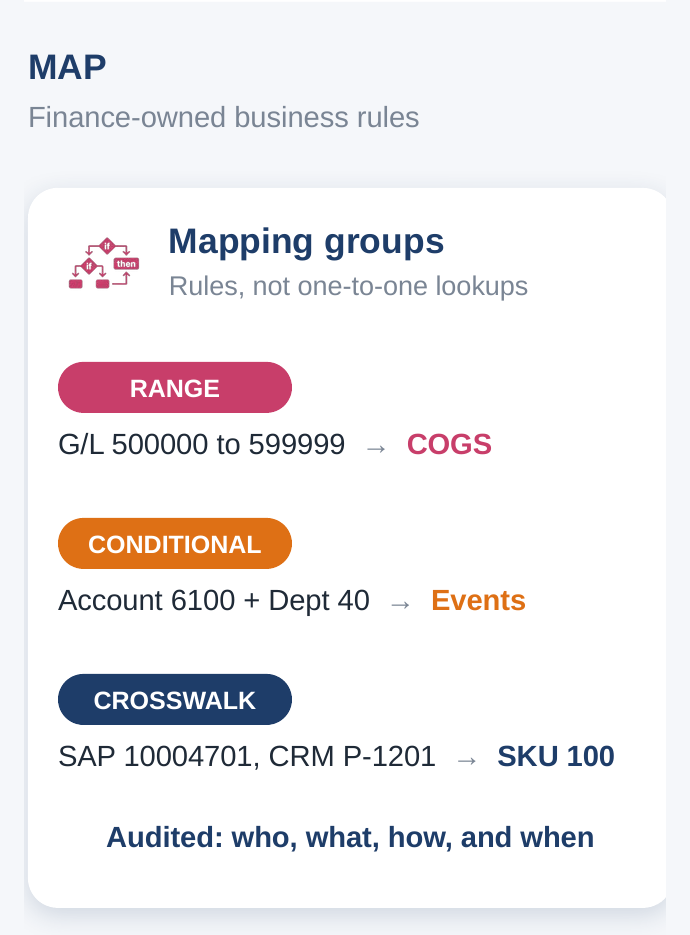
Once the data is in one shape, it still has to land at the level and in the structure the plan works in: the accounts, departments, and products the model is built around. Deciding how source codes roll up to those is a business decision more than a technical one, and it belongs with the people who own the numbers.
In Nexadata, those rules live in mapping groups. Mapping Copilot builds them from a description, and finance owns them after that. Here are the three kinds we see most, with the piece of the request behind each one:
- Range. Every G/L account from 500000 to 599999 rolls up to COGS. One rule covers the whole block, including accounts that get added next year.
”Map every G/L account from 500000 to 599999 to COGS.” - Conditional. Account 6100 maps to Events, but only when the department is 40. The same account can mean something different depending on who spent it.
”Map account 6100 to Events when the department is 40.” - Crosswalk. SAP material 10004701 and CRM product P-1201 are both SKU 100. Two systems, one product.
”Map SAP material 10004701 and CRM product P-1201 to SKU 100.”
Every change to those rules is logged: who made it, what changed, how, and when. When an auditor asks in March why an account landed in COGS, you can show them.
Ready to load into Pigment
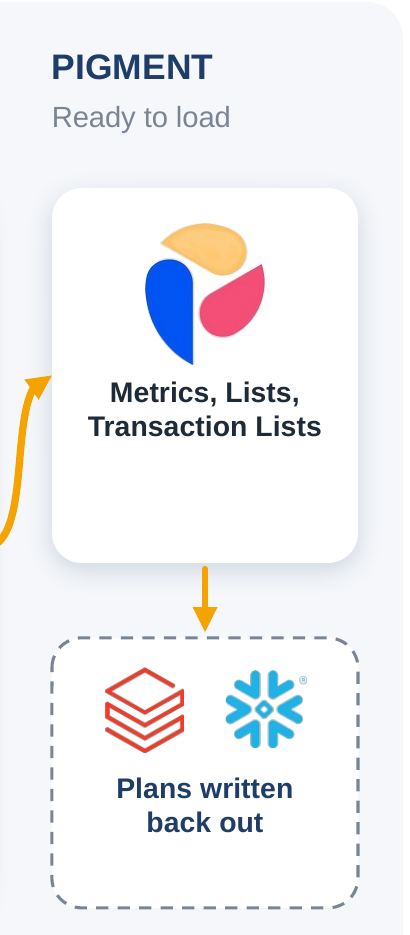
On the right, the result lands in Pigment as Metrics, Lists, and Transaction Lists, already in the shape the model expects. Pigment is where finance teams build the model, run scenarios, and work through the plan together, and with the data ready, they can get straight to that work.
Once the plan is set, it can flow back out as well, to a data platform like Databricks or Snowflake, so the forecast sits next to the actuals it came from.
The bar along the bottom of the diagram ties it together. All of this is built in natural language. The three Nexadata Copilots build the connections, transformations, and mappings from a stated goal, and the platform runs every Pipeline deterministically, so the same input produces the same output every time. The Copilots do the building, and the platform does the processing.

Running it works the same way. Through the Nexadata MCP server, the AI client your team already uses can start a Workflow, check on the run, and explain what happened when something needs attention. A person directs, the agent operates, and the platform does the processing.
Where each piece fits
When I look at this diagram, I see a split that makes sense. The way we put it with the Pigment team is that Pigment leads the planning model and Nexadata leads data preparation. Billing keeps running in SAP, sales keeps working deals in Salesforce, and finance decides how it all rolls up. Next month’s close starts from the same rules as this one.
Most people hear harmonization and think cleanup. I think of it as a translation finance owns, one they can run again next month without starting over.
Want to try it with your own data? We make it easy to get started. The Nexadata Quick Start Guide for Pigment walks through a first build end to end, and you can start a trial whenever you’re ready.
Nexadata is a Pigment technology partner.